[Gross Domestic Product] measures everything in short, except that which makes life worthwhile
Robert F. Kennedy, 1968
The Organization for Economic Cooperation and Development (OECD) has taken Kennedy’s words to heart. Through its Better Life Index, it is conducting an impressive work programme to analyse quality of life in the 34 developed countries that constitute its membership. The OECD index provides a broad overview of quality life, measuring the performance of countries on various important issues, from housing to environment and from civic engagement to life satisfaction. Like the Gross National Happiness (GNH) concept, the Better Life Index indicates what the good places to live are in a much broader sense than the mere economic data of GDP could do. Wealth’s correlation with happiness is limited at best, scientists have shown time and again.
But there remains a problem with this kind of national indices: they provide national averages – and do not say anything about the extremes and the equality of the data. California differs from Vermont. Sicily is not the same as Südtirol, the German-speaking part of Italy. To take account of regional differences in quality of life, the OECD has now released a similar website on regional well-being.
Some of the observations:
- The balance varies a lot across regions. In California, income, jobs and education are at higher levels then in Vermont, but for safety and civic engagement the golden state is a lot worse off than Vermont.
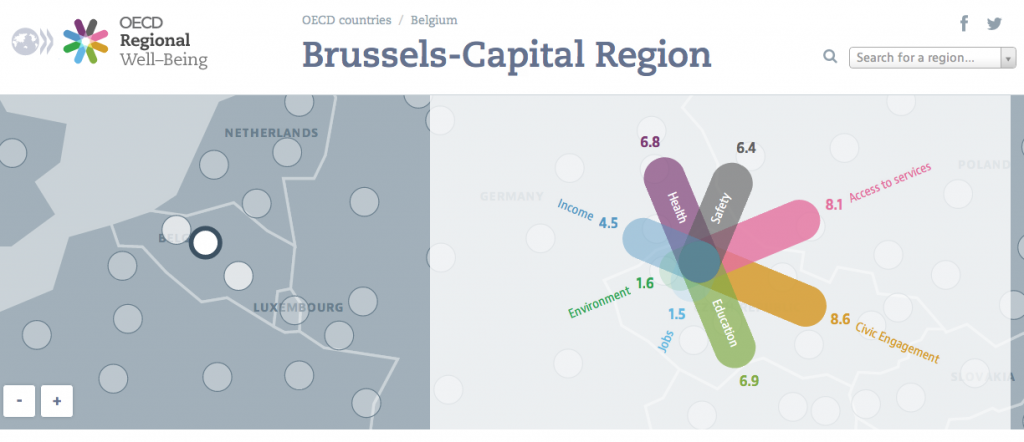
- Brussels is performing a lot worse on jobs (1.5 points out of 10) and environment (1.6) then I would think, but apparently has a high level of civic engagement (8.6).
- Across the board, Dutch regions reach high scores, except for income and environment. All over the Netherlands, safety and access to services are close to perfect 10s.
- Südtirol (or province of Bolzano) is indeed a different world from Sicily. The differences are most striking in the rate for jobs (8.8 vs 0.5). Italy’s figures confirm the large divide in incomes between North and South, whilst incomes are most equal in Austria.
- Czech regions, to my mind, score surprisingly bad in health but almost all have full scores of 10 for education, here defined as the level of people with secondary education or higher.
- The Mexican region of Jalisco has adopted well-being as a guiding principle in its policies. Still, it has a lot of space for improvement when compared with regions of richer OECD countries. The region already scores well on jobs and environment. And as a survey from a local NGO suggest, the comparable low scores do not mean that people perceive a low level of well-being. According to their figures, 67% in the region feels prosperous.

Brussels Capital Region, the region where I live, scores well on civic engagement and access to services, but has a lot to improve for jobs and environment. Source: OECD
So What?
Lists and rankings have a broader use than providing bloggers something to browse through on a Sunday night. They can bring order to life – be it by classifying which celebrities are hot and which are not lists, listing the best goals of the World Cup so far (no surprise, Flying Dutchman van Persie tops the list), or of countries which provide the most creative ideas (Ireland is first according to TED).
The OECD list, similarly, provides a benchmark of how regions performance. Seeing where you outperform peers or lag behind gives a motivation to improve. The index can help regions to decide where to focus their resources, and thus make better-informed decision how to spend civil servants’ time and money. As our representatives, politicians and administration should learn from these data. The data can help our administration to perform their duty: continuous improvement of our collective well-being.
Examples of well-being projects in some regions are already included on the OECD site.
