Tag Archives: Policy

Netherlands: wellbeing is more than wealth, new indicator shows

One of the Dutch traditions in May is ‘Woensdag Gehaktdag’ (a term so nice I won’t translate it). Every year, on the third Wednesday of May, the government justifies how it has implemented the budget in the last year, and the day the opposition fiercely criticises any misallocated cents.

Last week, however, Woensdag Gehaktdag saw an innovation: it saw the presentation of the first annual Monitor Broad Wellbeing. As I wrote before, this new indicator has been instigated by a parliamentary committee requesting a better toolset to evaluate how the Netherlands is doing in a broader sense than only economic indicators. Prepared by the statistics agency in cooperation with the planning agencies (for which my home country has a passion), the Monitor evaluates quality of life in three ways:

  • wellbeing here and now (how are we doing in the Netherlands, today)
  • wellbeing later (how do our choices today affect the future population of the Netherlands)
  • wellbeing elsewhere (how do our choices affect wellbeing elsewhere)

Throw in a mix of economic, social, environmental, trade and a few extra indicators, and you get a detailed picture of what wellbeing looks like. Where data is available, the Dutch performance is also compared with other EU countries.

A high quality of life, but…

So, how is our broad wellbeing? The conclusions of the report are as follows:

  • Overall, the Netherlands has a high level of quality of life. Many indicators show a positive trend over the last eight years, or a positive change with the year before. Only three out of 21 indicators were markedly negative: the number of people with obesity, satisfaction with free time, and size of nature areas.
  • Nonetheless, the figures aren’t equal. Some groups report lower scores: women, some ago groups (below 25 and 55-65), those with low education levels, and migrants.
  • Here’s the crux: wellbeing scores are clearly higher in the here and now then they are in the future and for the impact on elsewhere. Indicators concerning the future that post lower scores are primarily the environmental ones: CO2 and nitrogen emissions, fossil energy reserves, and biodiversity. Possibly, policy changes may see improvement here in the future, as energy is becoming cleaner and the Netherlands is due to stop all domestic gas production. However, the Netherlands large agro-food business has a massive and unsustainable footprint. You don’t directly see these negative externalities in simple indicators like GDP – a clear example of the value of the Monitor.
  • Another tricky piece is that current wellbeing is also connected with a negative impact in third countries. The Netherlands has a large carbon footprint and imports resources and biomass from elsewhere, including from least developed countries (LDCs). That means that natural capital is moved from those countries.
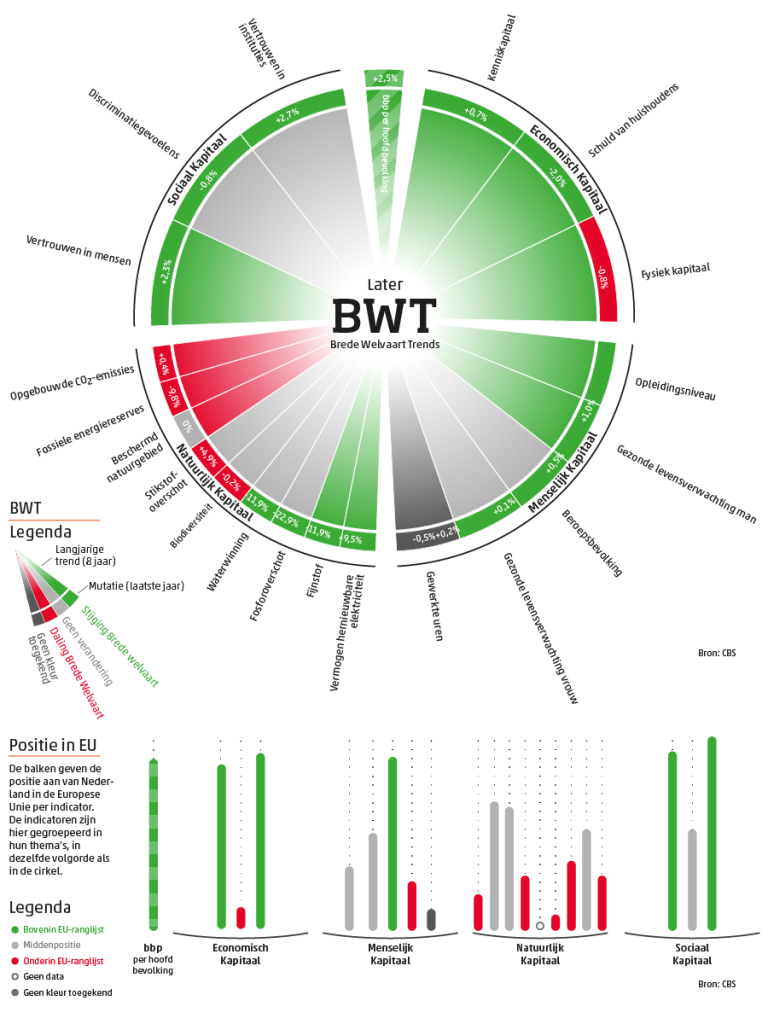
Broad Wellbeing Monitor, 'Later'. Source: Dutch Statistics Agency

Broad Wellbeing Monitor, ‘Later’. Source: Dutch Statistics Agency. Key: the graph evaluates the impact on wellbeing later across four categories: economic, human, natural, and social capital. Green/red represents positive/negative 8-year trends or 1-year net changes. The lower part of the graph shows how the Netherlands stand compared to fellow EU countries.

Back to politics

The report is a new annual feature, and should become a high-profile publication with an impact on policy formulation. For that, we go back from the statistics agency to politics, to the MPs and the cabinet we have mandated to make choices for us. This Wednesday will see the Parliament evaluate the government’s performance in a plenary debate, and MPs can use findings of the report to encourage the government to reshape their priorities. In this way, they can make the Netherlands a happier place, not only now, but also later and elsewhere.


Who do I vote for happiness?

Tomorrow my home country, the Netherlands, goes to the polls. The Dutch political system has a low barrier to enter the parliament. Especially this year, this leads to a proliferation of parties: there are 28 parties on the ballot, of which around 11 to 15 stand a stance to win seats according to recent polls.

The broad offer of political ideas also resulted in a large amount of online voting tools. Nowadays, about fifty sites offer tools to compare your views with party manifestoes. Apart from two big and generic ones, others help you to determine which party to vote if you are an entrepreneur, a young voter, if you want to see swift work on climate change, and even if you smoke cannabis (this remains the Netherlands…!).


A voting tool for happiness

But there is no tool on happiness. If I want to support a politician that promotes policies improving happiness and well-being, who should I vote? Does any politician ‘run on happiness’?

Happiness is a very tricky issue for politicians. Few politicians would directly promise to make their voters happy, and for good reasons. But if you dig a bit into some of the electoral manifestoes, a couple of ideas linked to wellbeing and the beyond GDP agenda do appear.


Four out of the seven large parties have some notion of happiness

Let’s run through the seven parties performing best in the polls; known as VVD, PVV, CDA, D66, GroenLinks, SP and PvdA in their Dutch acronyms.

Three of the main parties do not dedicate a single word to these ideas. For the one-page manifesto of the Freedom Party (PVV, Geert Wilders), this is not a surprise. It’s main aim is to ban things that does not make its leader happy: islamic, asylum seekers, the koran, and public expenditure on culture, wind mills, public broadcasters, etc.

For the Christian Democrats (CDA) and especially Labour (PvdA), I am a bit surprised not see a reference. Both have paragraphs on sustainable economic development, and the link to welfare and wellbeing could be easily made there.

The idea of basic income – arguably also a revision to the thinking about wellbeing – appears in some manifestoes. Some smaller parties wholeheartedly support it (including a dedicated basic income party), while Labour, Greens and Social Liberals (D66) favour experiments with this tool.


Liberals: we are happy already, nothing to do here

The Liberals (VVD) programme follows Prime Minister Rutte’s relentless optimism: if the Netherlands wouldn’t exist, we would invent it. We’re one of the happiest countries of the world. Almost nowhere else life is as good as here (the Netherlands second?). But the measures it then proposes do not concern happiness or wellbeing – the programme simply focuses on prosperity. Is our happiness then just a coincidence? If our basis is so strong, isn’t there any way to strengthen wellbeing even further?


Socialists: equality makes everybody happy

The Socialists (SP) start from the correct notion that people are happier in a country with smaller differences between people, and equality is a key objective of their policies. Elsewhere, the programme notes that there is more than GDP, and wellbeing and sustainability should be considered to measure prosperity. Surprisingly, this point does not lead to a plea for alternative indicators. Instead, the relevant paragraph continues to speak out against European budget rules…


Greens: GDP is not holy

The Greens include a section on a pleasant life, with mostly has to do with nature and spatial planning. Quality of life in our neighbourhoods should be improved, and with an allusion to Robert F. Kennedy, the programme states that “the value of the beauty of the landscape, nature and animal welfare cannot be expressed in money”.

Elsewhere, the manifesto states that ‘GDP is not holy’, and that “wellbeing is a lot broader: green growth with sustainable boundaries, based on knowledge and innovation; inclusive growth, that creates good jobs and fair incomes. That is what counts.” A couple of nice quotations, surely, and the manifesto is full of utopian ideas to get to such a society. Indeed, according to the Central Planning Agency that reviewed the impact of most parties’ programmes, the Greens gets us very far in reducing income differences. Revision in the taxation system should finance this: the Greens are the most radical in greening the taxation system via the ‘the polluter pays’ principle.


Social Liberals: measure wellbeing

The Social Liberals (D66) denounce both the dogma of a government that steps too far back and the dogma of the state as a ‘happiness machine’. The programme notes that employment and social expression contribute to people’s happiness. The party also has the most detailed view on measuring wellbeing. In a dedicated paragraph, the party states that we should not only measure GDP, but also evaluate our ecological footprint, welfare, and wellbeing. These elements should be evaluated to determine our success. And based on an amendment proposed by your happiness blogger, the programme also links this to the efforts ongoing on the Netherlands to develop an alternative indicator in the form of a ‘Broad Wellbeing Monitor’.


NL happy

Does GNH policy work? The answer is in common values

What is Gross National Happiness (GNH) actually good for? And how do policymakers in Bhutan really use their unique development tool?

In previous posts, I’ve dived into the methodology of GNH and crunched some of numbers behind the 43,4% of happy Bhutanese. GNH was once developed to provide an alternative to the logic of mere economic development. Obviously, in the end GNH is as good or as bad as it will be used. As an observer, it seems that Bhutan stands close to GNH, for instance in environmental policy and community life.

But to really know how it works, I asked Kent Schroeder at Humber College, Canada to help me find out if GNH leads to different government decisions. He should know: he did his PhD on the implementation of GNH in Bhutan, and interviewed around 150 policymakers on all levels.

Who’s doing GNH?

Schroeder told me that several Bhutanese institutions are working on GNH: the GNH Commission, the think tank Centre for Bhutan Studies (CBS), and the government.

  • The GNH Commission is a powerful body that is consulted by the government on the GNH effects of new policy initiatives. It’s reviewing new public policy initiatives before adoption. And the GNH Commission even publishes draft policies online, allowing the public to comment.
  • In addition, there is a policy screening tool, through which the Commission reviews the impact of a prospective policy on the nine domains of GNH. The tool scores all elements of the policy on a scale from 1 to 4: 1 means a negative impact, while 4 means a positive impact. In the EU bubble, we would call this a happiness impact assessment!
  • The most prominent example of the use of the policy screening tool leading to different results was the question on whether Bhutan should join the World Trade Organisation (WTO). After reviewing the consequences on GNH, the GNH Commission advise against becoming party to global free trade rules.
  • The CBS is also a highly recognised think tank, and is the driving forced behind the GNH index I’ve written so much about.
  • And then of course there are all policymakers at national, district and local level who formally all are required to follow the concept of GNH in their policies. Schroeder tells me that the GNH principle is taken into account for Bhutan’s five-year plans. In the next cycle, GNH will be devoluted, meaning that local administrations should take more responsibility. Officials can use local checklists similar to the national screening.

Does it work?

So, the means are there to effectively integrate GNH in public policy. But does it work in practice? To answer that question, Schroeder in his PhD thesis research reviewed four policy areas, namely media, tourism, farm roads, and human-wildlife conflict.

His conclusions about the effectiveness of GNH policies are as follows:

  • The influence of GNH on policy actions is unpredictable. Policies are shaped in a complex policy process, and the level of influence of different actors across policy areas and districts. As such, the impact of GNH policy tools on policy processes is limited.
  • Bhutanese citizens, and even policy makers, often do not understand what GNH really means. There is no common concept and these different interpretations also affect the policy process. Simply put, GNH is often not understood!
  • As a result, the outcome varies per policy area. Media and tourism policies largely reflect the aims of GNH. For farm roads, on the short term policy conforms with the GNH concept, but on the long term, Schroeder doubts its effect on sustainability. Finally, for the policies on the interaction on human and wildlife – a real issue in Bhutan where farmers often have to stay awake in the night to chase animals from their farmland – the result is mixed. This is also a consequence of the ambiguity of GNH.

Common values ensure GNH

Reading this, one would doubt the relevance of GNH as a concept. But there is no reason to be so dire. Even though the process is not as structured as the concept would suggest, the underlying values used by policy makers in determining their course of action typically conform with the values of GNH. As such, policy outcomes often reflect what GNH would imply – even if they’re not recognised as being connected with GNH!

Beyond GDP event: does happiness make good policy?

Can developing countries afford the money to develop happiness-based public policies?

Why is Saudi-Arabia a fairly happy country, despite low levels of personal freedom?

How is it possible that Sweden is one of the happiest countries of the world, but also a country with one of the highest suicide rates?

Are measures of happiness accurate? Shouldn’t weather and gastronomy be part of it, given their importance for happiness? 

This is just a snapshot of some of the great questions that I got fired on me from the audience at a conference on ‘Beyond GDP. Why Happiness Makes Goood Policy’. They provide plenty of material for future blog posts!

The event was organised by the Danish Embassy in Brussels and the Young Professionals and Foreign Policy (YPFP) in Brussels. Fortunately I wasn’t alone in answering them: I spoke alongside Marie Louise Dornoy of the Happiness Research Institute in Copenhagen.

Happiness is all about statistics

Apart from challenging my arguments and thoughts about the topic, I felt that the questions also revealed a deep interest and understanding from the audience. Happiness is a universal topic, and everybody in the room seemed to reflect on the question what happiness means for themselves and for society they live in.

As in many events, people were curious whether happiness and well-being can really be used in public policy. I feel that progress has been made in the last ten years to strengthen the scientific base and to gathering of statistical evidence underlying well-being policies. Often this is up to academia and central statistical agencies. As I formulated it during the event, happiness is a lot about statistics.

Local governments ‘experiment’ with happiness policies

For the concrete policy initiatives, it is especially local and regional authorities that are discovering and experimenting in this area. The great thing is that field is expanding quickly and that in a couple of years, we will have a lot more knowledge than we have now.

I raised the example of the ‘Geluksbudget‘ (Happiness budget, see here in Dutch) used in some Dutch municipalities. With this budget, socially deprived people are granted a sum of money they can invest in an intervention to increase their happiness. Marie Louise mentioned various initiatives, such as ‘National Neighbours Day‘ in the Netherlands, and the ‘Mobile Mini Circus‘ in Afghanistan. The Happiness Research Institute has also started to collect examples from happiness-based policies and so far has gathered about one hundred examples.


Want to know more?

See some tweets below and my powerpoint presentation to get an impression of the event. 

Part of the conference was live-tweeted. For some of the coverage, see the accounts @YPFPBrussels and @DKinBelgium or the hashtag #YPFPBXL


Social progress: a better way to measure a good society

For too long, Gross Domestic Product (GDP) has been the king of the indicators for public policy. Money makes the world go round. And GDP measures it. GDP emerged in the 1930s as a metric to measure the size of national accounts and inform policy makers’ decisions. Since, it has developed into a tool to benchmark countries’ performance: GDP growth is equated to progress.

GDP and beyond

Within the beyond GDP movement, many people have challenged this dominance, arguing that a good society is a lot more than economic performance. Social and environmental externalities are discounted in GDP. For instance, economists calculated that the Gulf of Mexico oil spill resulted in a higher GDP! And even GDP’s creator, economist Simon Kuznets, was aware of these limitations. When preparing the pile of statistic data for the US Congress in 1933, he noted that:

The welfare of a nation can scarcely be inferred from a measurement of national income.

Since, many have challenged the dominance as a benchmark in the countries’ annual performance reviews. Most competing indices aim to rebalance GDP, by providing economic performance and add other data in areas as social matters, environment and education. This is the case for indicators like the Humanitarian Development Index (HDI), the OECD’s Better Life Index and Bhutan’s Gross National Happiness.

And further beyond… all economic data!

The Social Progress Index (SPI), however, has a different approach.

The SPI differentiates itself from other challengers to GDP by its unique conceptual choice to stay away from economic data. Instead, it measures social progress via 52 concrete outcomes assessing three key indicators to measure progress: basic human needs, ‘foundations of well-being’, and opportunity (see more in this eloquent TEDx talk).

These concepts are assessed via a series of questions asking about people’s experiences in many aspects that matter for quality of life: how many people have shelter and sufficient water? Do people live in a sustainable ecosystem? How many people experience discrimination? Survey data allow to compare such outcomes based on what people feel, rather than by measuring social issues via public expenditure or laws.


Source: data from Social Progress Imperative, available here.

Social progress does not equate happiness

The SPI does not measure happiness or aim to do so. Still, a glance at the wealth of data produced by the SPi suggest that their ranking broadly overlaps with the data from the World Happiness Report. All the top time countries are the same, but in a different order. Switzerland, Iceland and Denmark form the top-three in happiness; for social progress it’s Norway, Sweden and Switzerland.

But there are some differences: especially Latin American countries seem to rank lower in the SPI. Countries like Costa Rica, Mexico, Brazil, Venezuela and Panama benefit from a ‘Latin American happiness bonus and make it to the top-25 in happiness, but fall short of the top-25 in social progress. To the contrary, some highly developed countries (Germany, France, Japan, South Korea) combine lower levels of happiness with higher levels of social progress.

A different data set for policy makers 

The main use of SPI as a policy tool is that it is adds knowledge on progress without building on economic data. From that perspective, it may be surprising that there nevertheless is a solid correlation of 0.78 between GDP and SPI. But SPI allows policy makers to make assessment from a different angle. The main benefit is to identify areas where a country is shortcoming comparing to peers with similar GDP levels, and to strengthen the information base about interventions that can address lower performance.

In recent years, policy makers’ interest in beyond GDP indicators has steadily risen. The SPI is also benefitting from this. The European Commission has started talks to integrate the SPI to monitor regional policy outcomes. And in the US, where social progress and happiness are lagging behind economic strength, several local and state level politicians have started to integrate SPI information in their dashboard of monitored outcomes. For instance, the city of Somerville, Massachusetts, has started analysing tailored SPI analytics on the local level. And in the state of Michigan, social progress indicators are included in a set of key performance indicators.

Data for a good society

This is exactly what alternative indicators should do. GDP has a value. Economic data provide a useful understanding about people’s lives. But if you want to find out what a good society is, and whether you are on an upward or downward trend, there is a lot more to watch. The SPI provides a great contribution to help policymakers find out on which areas they should work to make their country progress.

Juggling yellow stress balls – my message to the Foro Bienestar conference

What serious message can a tiny, bright yellow, stress ball with a smiley convey?

Last week I shared a couple of lessons I learnt from other speakers at the well-being and development conference in Guadalajara. Today, I wanted to tell you about the points of my own presentation.

Juggling a yellow stress ball

The panel I was on had the title ‘what is the role of governments in happiness of the people? I used this little yellow ball to illustrate my message. I realised that many participants were triggered by these little balls in their welcome pack. Some people took pictures of them, holding them in front of their face or their bag and tweeted them. Probably, others just left them in a corner or threw them away. And myself, I decided to juggle with them at the beginning of my speech.

Is there a message in (very poorly!) juggling with stress balls?

I argued there was. My point was simply: everybody will use tools you give them in a different way. You can bring a horse to the stream, but you can’t force it to drink. Sometimes a horse just wants to splash the water!

It’s the same with public policies: as a government you can design policies that you hope make people happier, but you can’t control how they will react. Still, I think there is large responsibility for governments to create the underlying conditions in which citizens can strive. Long-term well-being and quality of life combine subjective elements (our emotions, how we react to circumstances) and objective elements (the  environment we live in). This environment is partly shaped by governments’ economic, environmental and social policies. If good or bad choices are made, that will ultimately influence the quality of our lives.

In the speech, I tried to give my own ‘little stress balls’, or methods to enhance quality of life. I made three suggestions to the policy makers in the room:

Integrated measurements of well-being

Firstly, I advised them to carefully measure the well-being in their jurisdiction. Well-being indicators from all areas – economy, environment, social affairs, health, education, and others – should be measured together, rather than in isolation. Now, in most countries, GDP is the main metric that is used in public policy. I argue that a dashboard of several indicators, such as in the OECD’s Better Life Index, is a good tool to have an additional layer of information. As such, policy makers can detect in which area improved policy outcomes can win the most in terms of quality of life. This can help them to focus their resources on the areas where they can make the biggest difference.

jb at forobienestarTreat well-being as a political agenda

Secondly, I suggested to treat well-being as a political agenda like any other. If the focus will be more on quality of life and well-being, and less on purely economic growth, that is a massive shift in policy! Administrations know that they have to communicate all their policies to citizens and engage in a public debate to explain the choices the made. This applies to well-being just the same as to other areas.

It starts with happiness at work

Thirdly, I advised to also look at the happiness at work of staff in the administration. Motivation and job satisfaction at an individual and team level massively affect the success that an administration will have in the implementation of it its policies. Surveys can be used to monitor and improve work satisfaction and working conditions of the staff responsible to deliver the well-being policy objectives set by politicians and policy makers. Only happy staff can create happy citizens.

Now it is to the administration of Jalisco to translate the lessons from me, and all other speakers, into new and better policies. To be continued!

(and next week, I’ll face one of the other questions debated on the conference: why are Mexicans so happy?)

yellow balls

The power of negative emotions – and two other lessons of the Foro Bienestar

I just came back from two weeks in Mexico. During these weeks, I fled the Brussels grey, rain and cold to replace it by the occasional Mexico City grey, the jungle rain, and Pacific coast warmth. Moreover, I spent a couple of days at the Foro Bienestar (International Forum of Well-Being and Development) in Guadalajara, where I was invited to speak. In the next two weeks, I’ll offer some thoughts about my own presentation on happiness and public policy and about the question ‘why are Mexicans so happy’ that was the leitmotiv of the conference. However, today I wanted to share some insights about the main points that I took home from the conference. Are you ready? Here we go!

Don’t forget the power of negative emotions

IMG_1937

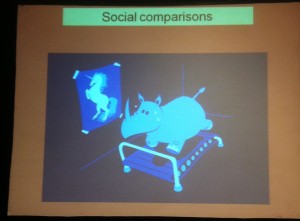
Speaking of negative emotions: this slide by Stefano Bartolini (University of Siena) shows the problem of social comparisons and happiness very well.

Most of the speakers were academics and the good thing about academics, contrary to some happiness consultants, is that they don’t allow themselves to be carried away by their enthusiasm so much that they forget that being happy all the time is not possible and not desirable. Negative emotions are a necessary counterweight to positive ones. In a simple metaphor: feelings are a mountainous landscape. Without the valleys of anger, frustrations and anxiety, the happy peaks of joy, tranquility and exaltation would not be happy peaks but part of a plain.

Robert Biswas-Diener, often labelled as a positive psychologist, brought this forward most prominently. Answering his own question ‘how happy should an individual be?’, he suggested that the ideal rate of positive and negative emotions might be positive 80% of the time and 20% negative of the time. Being happy all the time does not do justice to real and important feelings as guilt, grief and anger. For instance, as he also discusses in his book ‘The Upside of your Dark Side‘, guilt can motivate us to work harder and accomplish more than we ever could do if we’d be simply content with everything.

Measuring happiness is very, very simple and very, very, complex

A large part of the conference was dedicated to one simple question: how do you measure happiness? It is clear that there are many ways to do so: the World Happiness Database at the Erasmus University Rotterdam knows 963 different methodologies, said Jan Ott.

But professor John Helliwell, one of the authors of the UN World Happiness Report, explained these can be summarised in a couple of simple ways. One way is to ask people how happy they are in a specific moment. This can be happiness in the ‘now’, to grasp a person’s feelings most accurately, or a moment like ‘yesterday’ or even longer ago, to prevent that events limited in time have a major influence. Such a question can be answered very quickly, without a lot of thinking. A second way is to ask a more reflective question, asking how satisfied you are with your life as a whole. Questions asking about positive or negative emotions typically give more random and diverse answers.

The debate is open on happiness as a policy objective

Picture from the opening session. Source: La Jornada de Jalisco.

Picture from the opening session. Source: La Jornada de Jalisco.

In my opinion, it should be obvious that governments would aim to increase quality of life and well-being – happiness if you want – especially where incomes increase and poverty reduces. Still, using insights about happiness and well-being in public policy is quite scarce: another research to welcome that Jalisco, the region where Guadalajara is located, is facing the challenge. Meik Wiking, from the Danish Happiness Research Institute, identified that taking happiness as a political goal is a trend. But there is also a counter-trend: skepticism about government efforts to formulate happiness policy objectives.

Professor Bruno Frey strongly advanced the argument that with happiness as a policy objective, there would be major incentives to governments to manipulate data, for instance by excluding people with lower happiness and by  falsification of indicators. In a high-level debate – the Tyson vs Ali of  happiness researchers – he was taken on by professor Helliwell, who thought these risks could be reduced as methodologies will be tweaked over time and that manipulation could be constrained in a democratic society.

Beyond GDP, a long road to travel

Almost fifty year since the famous speech by Robert F. Kennedy, and almost ten years after the start of a thorough debate on ‘beyond GDP’, it’s time to meet the unfilled promise.

On some occasions before, I have written blog posts to encourage EU policy makers and politicians to step up their ambitions and integrate ‘beyond GDP’ indicators in their policies. For instance, see posts on ‘Gross European Happiness‘ or ‘An EU Happiness Manifesto‘, and an essay I wrote for the Next Generation for Europe magazine NGE Magazine 1 (Chapter three, pdf).

And I must say, the topic is on the agenda. I recently had the fortune to attend a European Commission expert conference on ‘beyond GDP’. Noting the importance of the topic, the conference was opened by two outgoing Commissioners: Laszlo Andor, for Social Affairs, and Janez Potocznik, for Environment.

Winning the battle of measurement…

How to make the giant leap from theory to practice? Enrico Giovannini, a former Italian Minister and OECD Chief Statistician, has pushed the debate on GDP forwards in the recent decade. He asked whether those supporting the idea of beyond GDP have won or lost in the debates from the last years. His conclusion was that the ‘battle of measurement’ has been won. In comparison to ten years ago, national statistic offices do a lot more effort to measure what matters.

Routine measurements of social and environmental indicators allows us to get a broader understanding of quality of life than economic growth and inflation could give us. They are more and more interested in collecting and refining social figures on employment rates, NEET rates (people Not in Education, Employment or Training – a proxy for youth employment), and inequality-adjusted GDP growth. Environmental numbers like generated waste, emission of green house gasses and water use also gain more prominence. And new indices like the OECD Better Life Index treat all indicators equally.

OECD

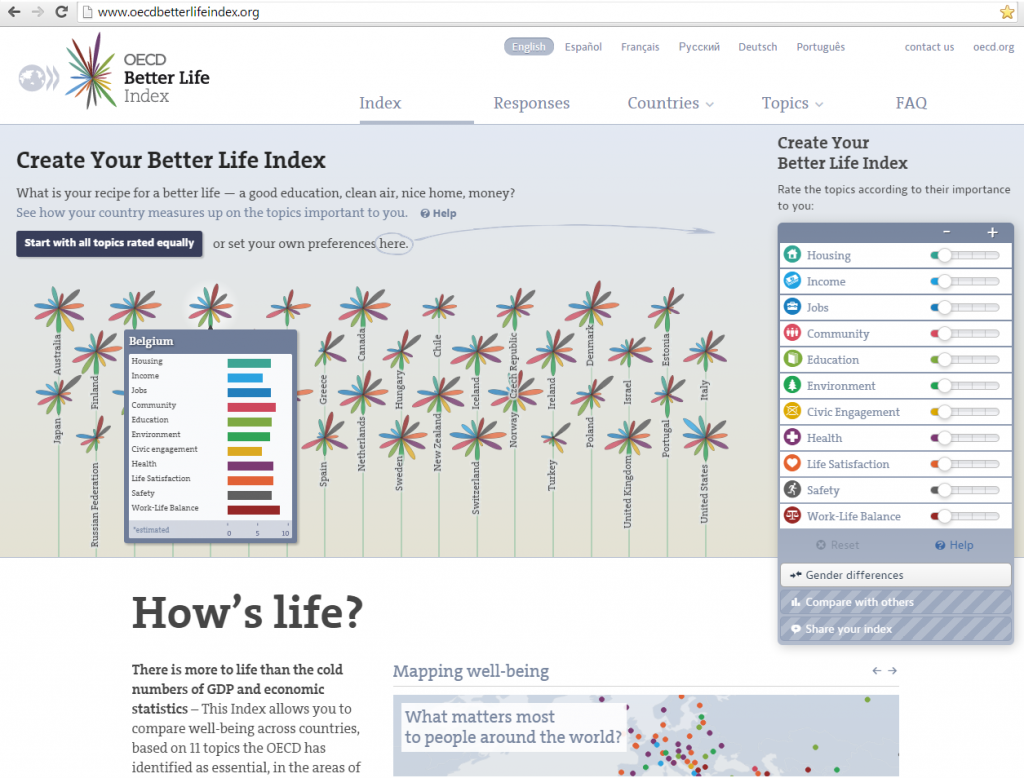
Screenshot of the OECD Better Life Index website

… but the battle for policy must still be fought

There are two questions around this: do we measure enough? And do we do enough to exploit this massive amount of data and adapt our policies to it? When asking whether we won the battle of policy, the answer from Giovannini is simple – no. If you want to make simple policies from these crunched numbers, you have to make trade-offs. How much air pollution is an increase in GDP of 1% worth? How much fossil fuels can you burn to lift one thousand people out of poverty? And what, objectively, is well-being anyway? These are incredibly difficult questions to answer. Economic growth is a lot easier objective. There is no easy way out.

Can economic, environmental and social betterment go hand in hand? The Commission – via its stated objective of smart, sustainable and inclusive growth – thinks so. But MEP Philippe Lamberts doesn’t agree. He believes that in a finite planet, sustainable growth is an inherent paradox. From an environmental perspective, we may need degrowth; but at the same time, that has consequences on employment. And, higher growth is also associated with more money invested in environmental protection.

How do you cut this Gordian knot?

The quest for perfection limits action

Nobody can easily answer these complex these questions. But I can offer my own conclusions:

  1. A lot of laudable work is being done by statisticians and policymakers, especially in social and environmental departments. With a lot of conviction and passion, they had managed to put the issue on the agenda. But they need to get economists more involved in these debate to get more leverage. It was telling that very few participants were trained economists.
  2. Call me a pessimist, but my feeling is that the political momentum behind the beyond GDP drive is fading. There are generic references to the agenda, but the policy efforts needs to be stepped up. In my view, policymakers need to be more courageous and bring their policies to main stream politics. That requires broad political campaigning and communication, as the new economics foundation also writes (pdf). Reports don’t change reality. Action does.
  3. Finally, maybe it is a quest for perfection that is limiting action. A perfect measurement of well-being does not exist. If you group indicators together in one figure – say well-being is ’42’ – you can make little sense of it. Similarly, a ‘dashboard’ with eleven different figure as in the OECD Better Life Index can be difficult to apply. But in this case, it appears the perfect is the enemy of good. GDP also has been refined often. It’s better to refine measures and policies of well-being on the way than to never start the journey.

Beyond GDP: a long road to travel, but one that is worthy to go.

Where the life is good: the OECD’s Regional Well-Being index

[Gross Domestic Product] measures everything in short, except that which makes life worthwhile

Robert F. Kennedy, 1968

The Organization for Economic Cooperation and Development (OECD) has taken Kennedy’s words to heart. Through its Better Life Index, it is conducting an impressive work programme to analyse quality of life in the 34 developed countries that constitute its membership. The OECD index provides a broad overview of quality life, measuring the performance of countries on various important issues, from housing to environment and from civic engagement to life satisfaction. Like  the Gross National Happiness (GNH) concept, the Better Life Index indicates what the good places to live are in a much broader sense than the mere economic data of GDP could do. Wealth’s correlation with happiness is limited at best, scientists have shown time and again.

But there remains a problem with this kind of national indices: they provide national averages – and do not say anything about the extremes and the equality of the data. California differs from Vermont. Sicily is not the same as Südtirol, the German-speaking part of Italy. To take account of regional differences in quality of life, the OECD has now released a similar website on regional well-being.

Some of the observations:

  • The balance varies a lot across regions. In California, income, jobs and education are at higher levels then in Vermont, but for safety and civic engagement the golden state is a lot worse off than Vermont.
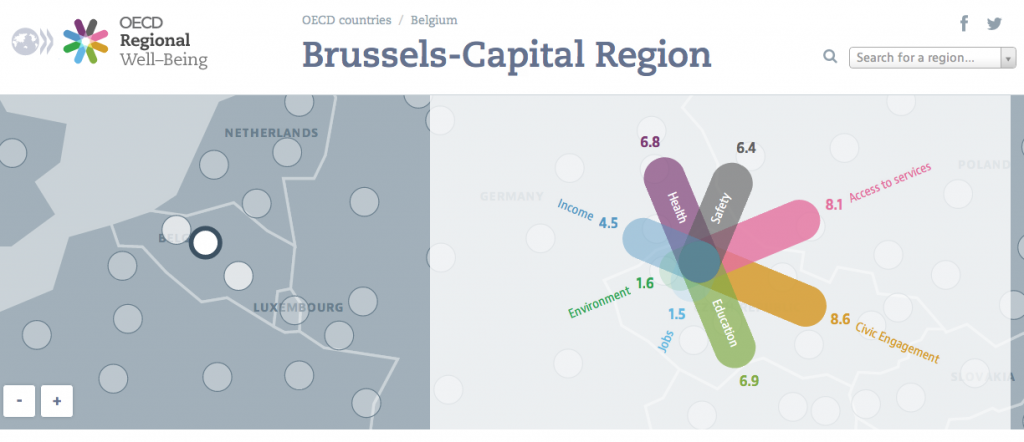
  • Brussels is performing a lot worse on jobs (1.5 points out of 10) and environment (1.6) then I would think, but apparently has a high level of civic engagement (8.6).
  • Across the board, Dutch regions reach high scores, except for income and environment. All over the Netherlands, safety and access to services are close to perfect 10s.
  • Südtirol (or province of Bolzano) is indeed a different world from Sicily. The differences are most striking in the rate for jobs (8.8 vs 0.5). Italy’s figures confirm the large divide in incomes between North and South, whilst incomes are most equal in Austria.
  • Czech regions, to my mind, score surprisingly bad in health but almost all have full scores of 10 for education, here defined as the level of people with secondary education or higher.
  • The Mexican region of Jalisco has adopted well-being as a guiding principle in its policies. Still, it has a lot of space for improvement when compared with regions of richer OECD countries. The region already scores well on jobs and environment. And as a survey from a local NGO suggest, the comparable low scores do not mean that people perceive a low level of well-being. According to their figures, 67% in the region feels prosperous.
Picture 1

Brussels Capital Region, the region where I live, scores well on civic engagement and access to services, but has a lot to improve for jobs and environment. Source: OECD

So What?

Lists and rankings have a broader use than providing bloggers something to browse through on a Sunday night. They can bring order to life – be it by classifying which celebrities are hot and which are not lists, listing the best goals of the World Cup so far (no surprise, Flying Dutchman van Persie tops the list), or of countries which provide the most creative ideas (Ireland is first according to TED).

The OECD list, similarly, provides a benchmark of how regions performance. Seeing where you outperform peers or lag behind gives a motivation to improve. The index can help regions to decide where to focus their resources, and thus make better-informed decision how to spend civil servants’ time and money. As our representatives, politicians and administration should learn from these data. The data can help our administration to perform their duty: continuous improvement of our collective well-being.

Examples of well-being projects in some regions are already included on the OECD site.